Step 5 Dictionary
Table of contents
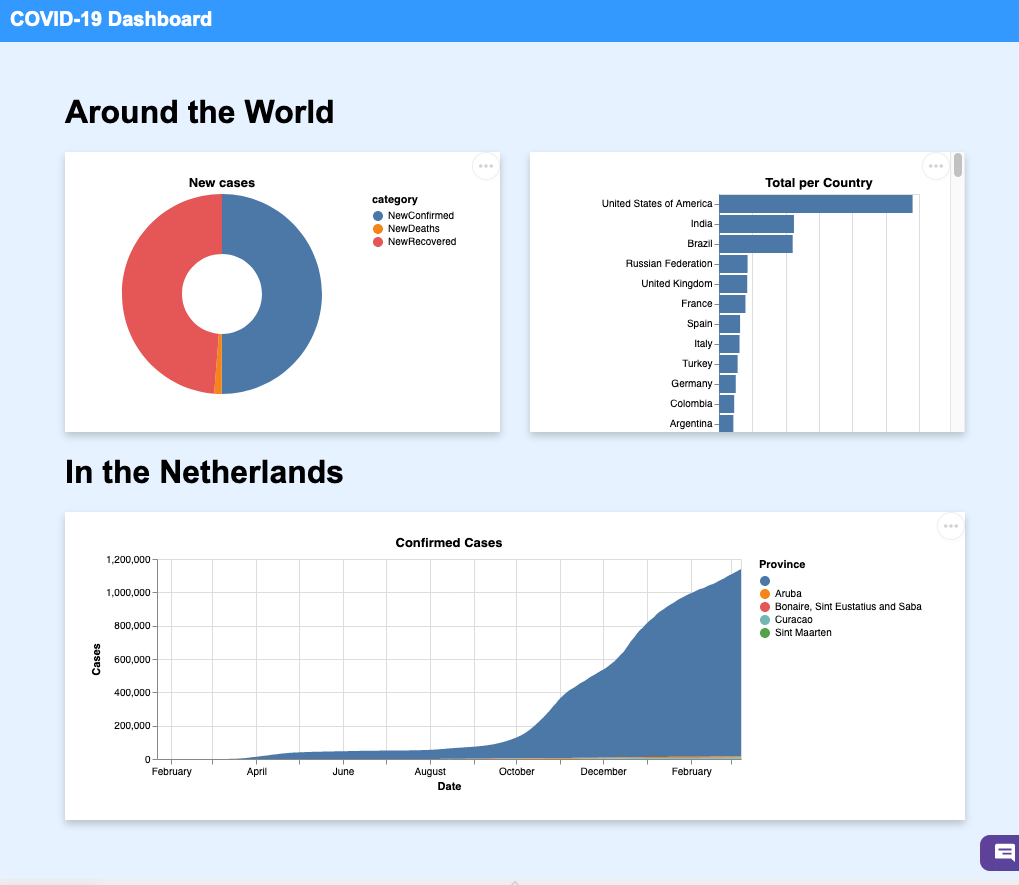
We walked through the complete cycle of setting up a visualisation, downloading data to inject it into the visualisation and rendering this visualisation as part of an HTML/CSS/JavaScript dashboard. In this step, we repeat these steps to add two additional charts.
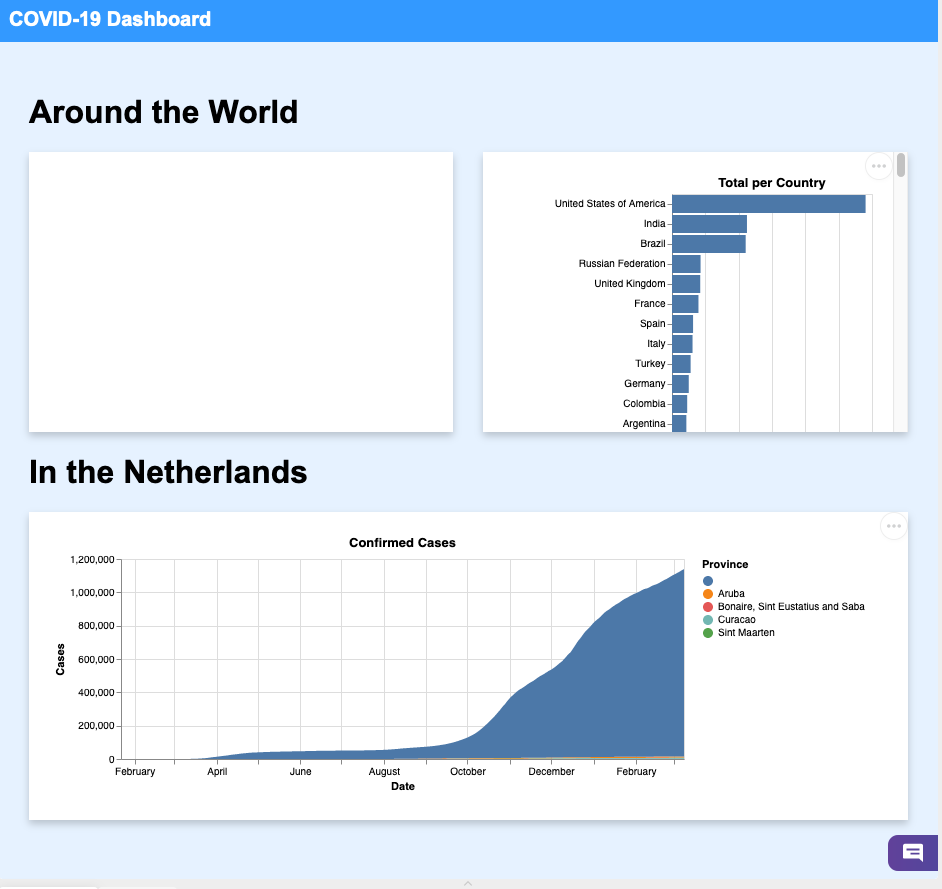
Task 5.1 Display Netherlands History
This time we want an area chart mapping the case history in the Netherlands. First, we have the template, which includes the same elements as the previous chart. We look for an area chart. We can copy and paste this template in templates/history.json.
1
2
3
4
5
6
7
8
9
10
11
12
13
14
15
16
17
18
19
20
21
22
23
24
25
{
  "$schema": "https://vega.github.io/schema/vega-lite/v5.json",
  "width": "container",
  "title": "Confirmed Cases",
  "data": {
    "values": []
  },
  "mark": {
    "type": "area",
    "tooltip": true
  },
  "encoding": {
    "x": {
      "field": "Date",
      "type": "temporal"
    },
    "y": {
      "field": "Cases",
      "type": "quantitative"
    },
    "color": {
      "field": "Province"
    }
  }
}
Similarly to Step 3, we need to combine this template with the data. However, we select the template ‘history.json’ and take the data from the function download_confirmed_per_country().
1
2
3
4
    # Load JSON template from history.json
    # Download the confirmed cases of the Netherlands from the COVID API
    # Add the data (key "data") to the template (key "data" > "values")
    # Send the chart description to the client
Run the code and trigger the route /netherlands to see the template together with the data.
In static/index.html, we can add the call to vegaEmbed at the bottom, next to the existing vegaEmbed from the first chart.
1
vegaEmbed('#netherlands', '/netherlands');
Let’s fix a layout styling detail. As the chart is wide, it would fit better on the full length of the page. We could add an id property to the second section to apply some CSS on that specific element. Another strategy is to add the class property. While an id must be unique, we can use a class in many elements. As we might want to create several charts for other countries to compare, the class seems an appropriate choice. Add the property class="country" to the second section. Then, add the following in the _CSS_to increase the grid’s size for this particular section. Note the dot . in contrast with the hashtag # to target the name of a class instead of an id.
1
2
3
4
.country {
  grid-template-columns: repeat(auto-fill, minmax(600px, 1fr));
  text-align: center;
}
Task 5.2 Display New COVID Cases
For the new COVID cases, we use a similar Vega template. This time, we use the type arc to represent a pie chart. Create a file templates/new.json and paste the following JSON structure.
1
2
3
4
5
6
7
8
9
10
11
12
13
14
15
16
17
18
19
20
21
22
23
24
25
26
{
  "$schema": "https://vega.github.io/schema/vega-lite/v5.json",
  "width": "container",
  "title": "New cases",
  "data": {
    "values": []
  },
  "mark": {
    "type": "arc",
    "innerRadius": 40,
    "tooltip": true
  },
  "encoding": {
    "theta": {
      "field": "value",
      "type": "quantitative"
    },
    "color": {
      "field": "category",
      "type": "nominal"
    }
  },
  "view": {
    "stroke": null
  }
}
The data regarding the new COVID cases, together with each country’s details, is part of the /summary API. The new COVID cases are located at the key Global. It is an opportunity to see how to loop through a Python dictionary.
We see the construction for key in json_data["Global"] in the following example. It means we loop through all the keys as part of the nested Python dictionary ‘Global’. It allows us to filter keys that start with ‘New’, including ‘NewConfirmed’, ‘NewDeaths’ and ‘NewRecovered’.
The function serve_summary_new() looks as follows:
1
2
3
4
5
6
7
8
9
10
11
12
13
14
15
16
17
18
# Load json template from new.json
  json_template = json.load(open("templates/new.json"))
  # Download summary from the COVID API
  json_data = download_summary()
  # Create an empty list of value to receive filtered and formated data
  values = []
  # For all data in the "Global" structure
  for key in json_data["Global"]:
    # Keep the 'New' entries (skip overall totals)
    if key.startswith("New"):
      # Create a dictionary with 'category' and 'value'
      value = {"category": key, "value": json_data["Global"][key]}
      # Add the dictionary to the list of values
      values.append(value)
  # Add the data to the template
  json_template["data"]["values"] = values
  # Send the chart description to the client
  return json_template
Run the code and trigger the route /new to see the template together with the data.
In static/index.html, we can add the call to vegaEmbed at the bottom, next to the existing vegaEmbed from the first chart.
1
vegaEmbed('#new', '/new');