Step 1 Review
Table of contents
- Step 1 Review
- Task 1.1 Set Up a Web Server
- Task 1.2 Explore the COVID-19 API
- Task 1.3 Trigger API from a web browser
In the previous assignment, we used Flask to serve the result of our generative art. It was a big step forward, moving from the local Terminal output to exposing results to the web. The web serves information. It makes it a convenient prototyping tool to shape digital user interactions. That is what we will explore further with the COVID dashboard. How do we collect data from a web service? How do we filter and shape data the way we need it for our design? How do we generate charts and put them together in a structured dashboard? Well, this is what we practice in this programming assignment.
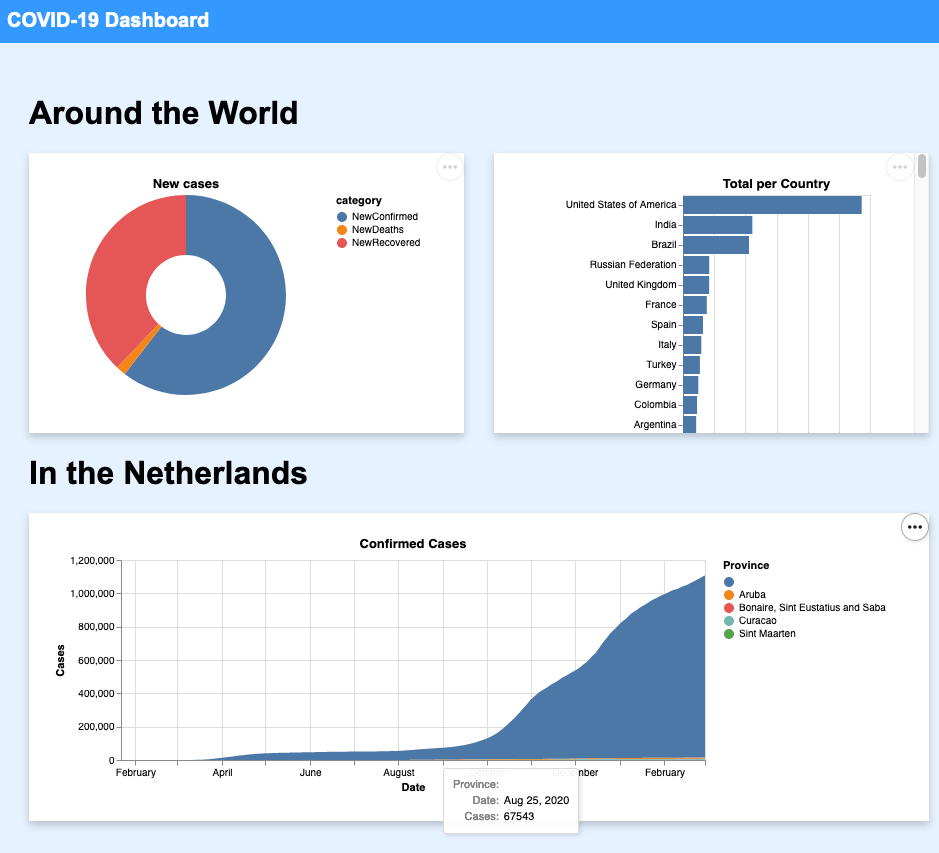
The result of the fifth step looks as follows, but as you already know, this is just a starting point. Your role as a designer is to take these starting components to the next level. Next, we’ll provide you with some hints in Step 6.
Task 1.1 Set Up a Web Server
Let’s start with what we already know from the previous assignment. First, go to Replit, in the project you connected to GitHub.
Then, Go to the package manager and install Flask, the Python package we use to make a web server. Have a look at Task 3.1 of the previous assignment if you struggle to find your way with this.
As we can see from the screenshot above, we aim to generate three different charts:
- Ring chart: the ‘New Cases’ in the world in the last 24hrs;
- Horizontal bar chart: the ‘Total cases per Country’;
- Area chart: the distribution of ‘Confirmed Cases’ in a given country over time.
Thus, we can structure our code with three HTTP routes with associated Python functions to serve each chart. In addition, we will need a fourth one to serve the dashboard itself.
COVID Dashboard HTTP Routes
1
2
3
4
5
6
7
8
9
10
11
12
13
14
15
16
17
18
19
20
21
Import the object Flask from the flask module

Create a webserver object called 'COVID Dashboard' and keep track of it in the variable called server

Define an HTTP route / to serve the dashboard home web page
Define the function 'index()' and connect it to the route /
Return the string "A nice COVID dashboard."

Define an HTTP route /summary to serve the summary chart
Define the function 'serve_summary()' and connect it to the route /summary
Return the string "A bar chart summary of COVID cases per country."

Define an HTTP route /new to serve the new count worldwide chart
Define the function 'serve_summary_new()' and connect it to the route /new
Return the string "A pie chart summary of new COVID cases globally."

Define an HTTP route /netherlands to serve the chart of the Netherlands
Define the function 'serve_netherlands_history()' and connect it to the route /netherlands
Return the string "An area chart of COVID cases over time in the Netherlands."

Start the webserver
Copy and paste this English description in the file main.py of your Replit project as comments. Then, convert each line into its Python implementation. Note that for now, our HTTP routes are returning a string. It is because we are just putting in place the general structure of our web server.
Don’t remember the syntax? You might want to look at the previous assignment, Step 3 (Serve web page Python Syntax), for a reminder on the syntax.
Execute the code and visit the four HTTP routes /, /summary, /new and /netherlands to check that you receive the four sentences as expected.
Task 1.2 Explore the COVID-19 API
There is only so much we can do for a COVID dashboard without actual data. So let’s look at a web service that can provide us with the latest data. We rely on the API covid19api.com. Have a look around and see for yourself what this service is promising.
Why this choice? A registration-free and easy-to-use API enables our dashboard to show the latest COVID data. It would not work for a product because there are limitations to the free service, such as how many times we can request the data within one day. However, it fits our prototyping needs ideally.
How to get started? There is a documentation link on the front page towards the bottom. It looks like an excellent place to start. Next, we land on a page of Postman, a tool for developing and documenting APIs.
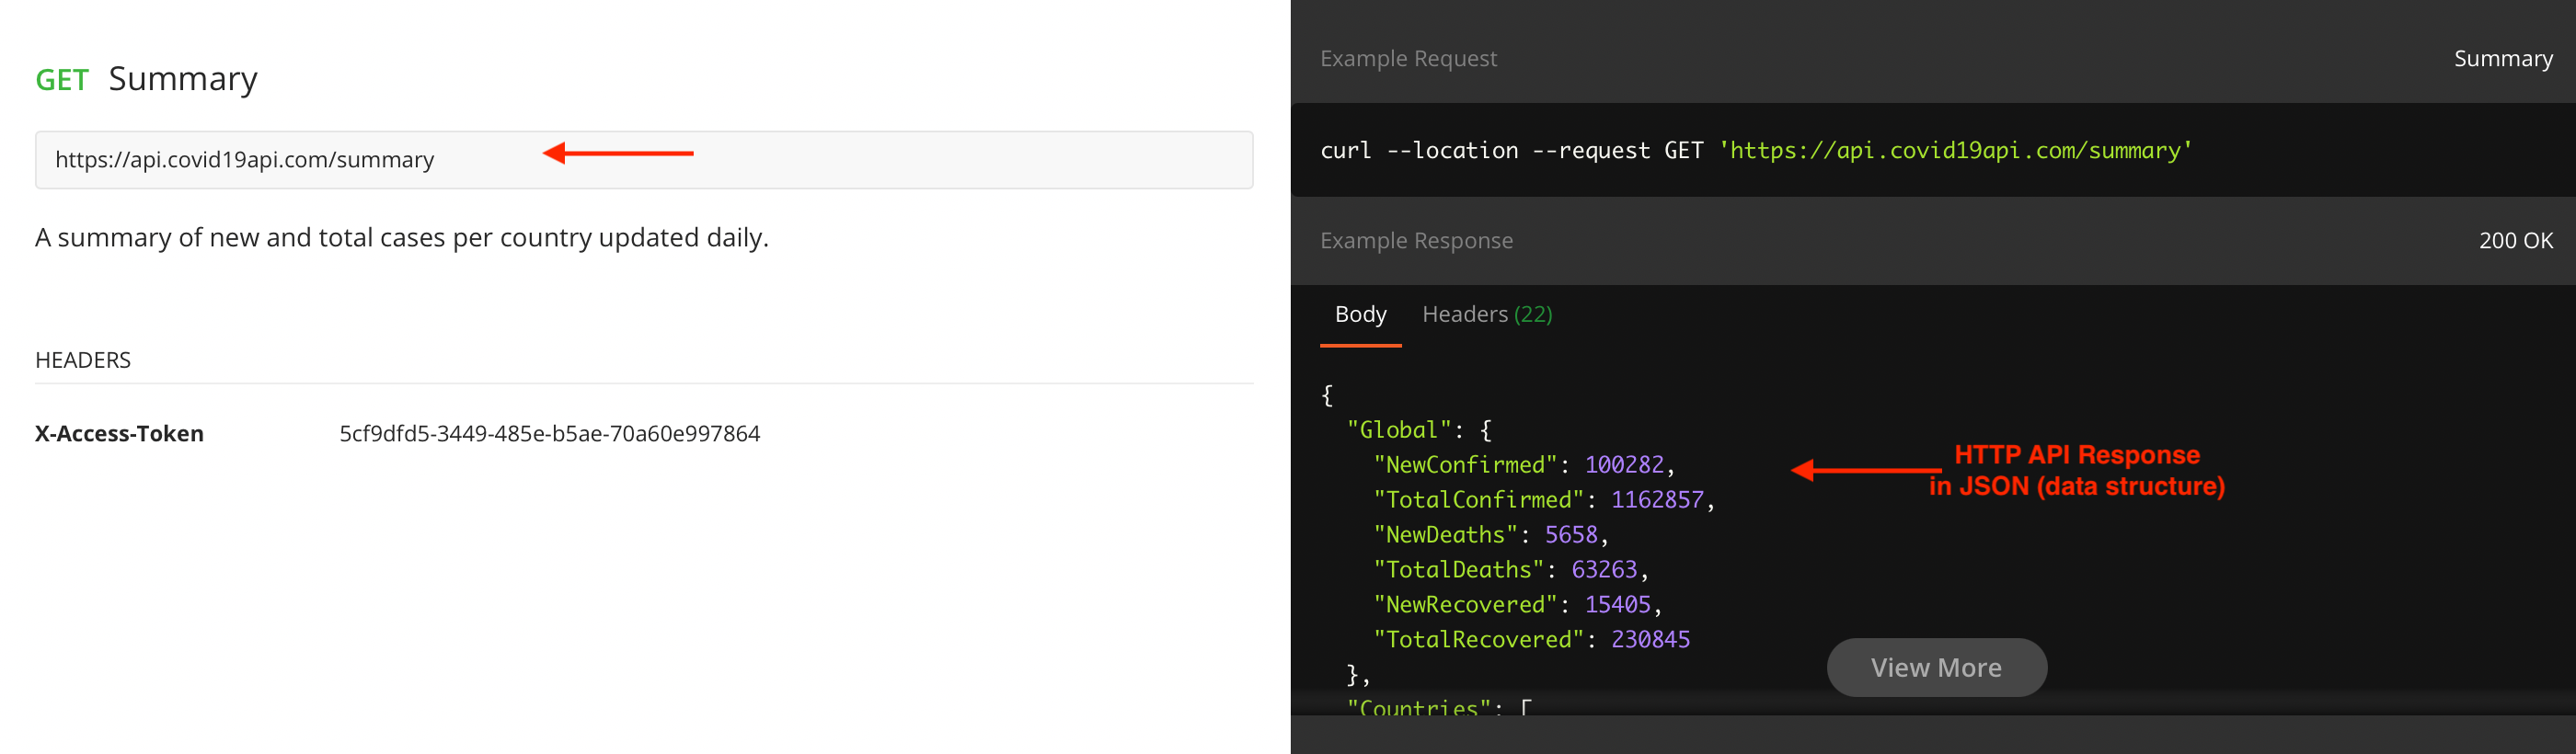
This assignment focuses on two APIs: the /summary and the /countries. From the /summary API, we can extract the total number of cases per country up to now (the bar chart of our dashboard on the right) and the total of new cases in the last 24 hours (the doughnut chart on the left).
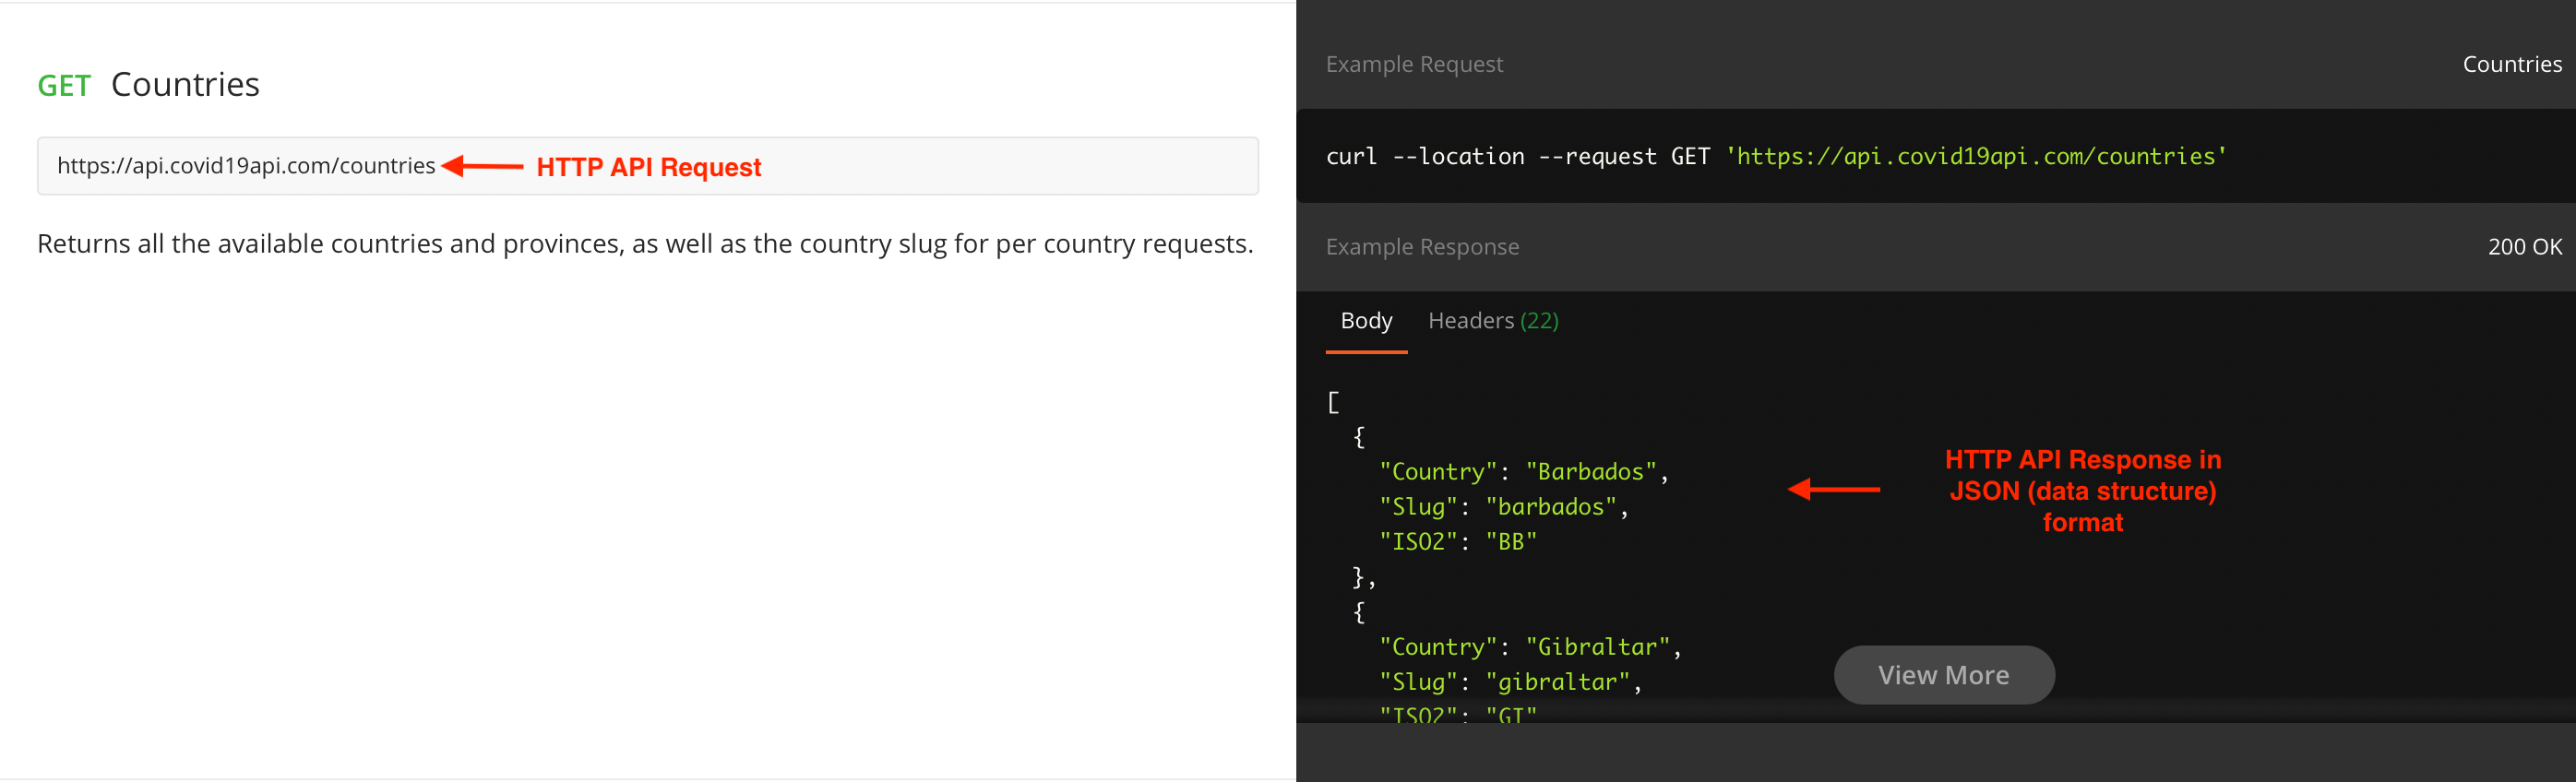
From the /countries API, we can extract the historical data for a specific country, such as the Netherlands (the area chart of our dashboard at the bottom).
Task 1.3 Trigger API from a web browser
To see what the data looks like, copy and paste the URL of each API in your favourite web browser. Once loaded, you should obtain something like this:
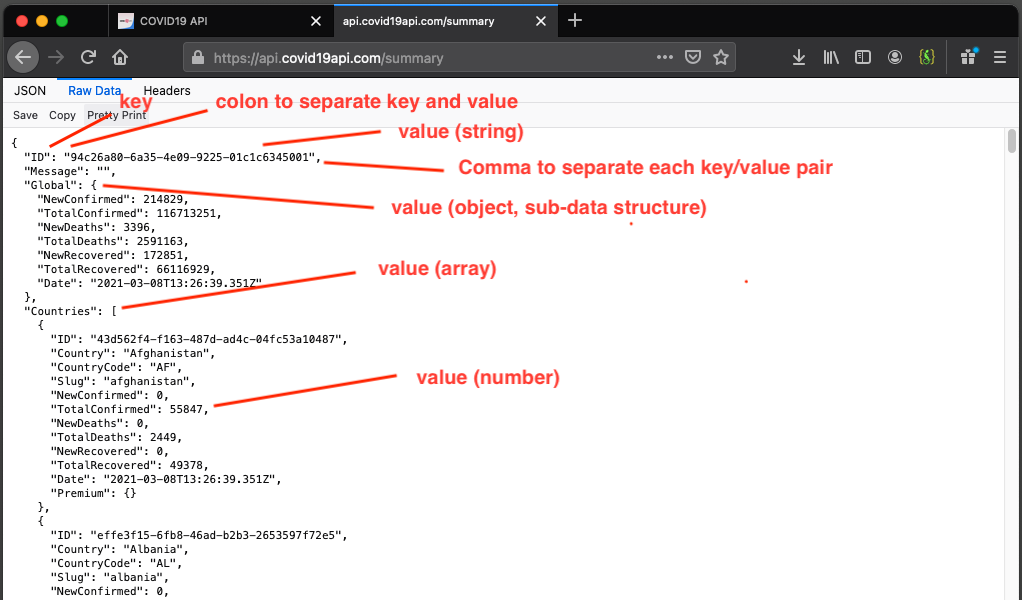
Note: depending on the web browser, the result is shown on multiple lines or kept “as raw”.
The data is structured in the JavaScript Object Notation (JSON, pronounced ‘Jason’) format. It is a typical data structure for sharing or storing data on the web. It starts and ends with curly brackets {}, and it is composed of key/value pairs separated by a colon and a comma between each pair. The value can be of the following types:
- a string (with double quotes, similar to Python);
- a number;
- a boolean (true or false)
- an array (a list of values separated by a comma, delimited by square brackets
[]) - an object (a sub-JSON structure, delimited by curly brackets
{})
We can see in this example that we have first the key Global, leading to a sub-JSON structure with the latest global COVID statistics. Then, we have the key Countries, leading to an array. Each JSON structure in this array represents the latest COVID numbers for a specific country.
In the next step, we will see how to get this COVID data directly in our Python code.