Step 1 Review
Table of contents
- Step 1 Review
- Task 1.1 Draw a Line
- Task 1.2 Make the Drawing of a Cross
- Task 1.3 Draw the Drawing of Radial Lines
What is SVG?
In this initial step, we only use Python syntax we already encountered in the previous assignments. We particularly reuse functions, loops and files. First, however, we need to introduce what we will play with: Scalable Vector Graphics (SVG). You might use Illustrator or Inkscape to draw on your computer. These tools keep track of what we draw as a list of objects. SVG is a data format to save all the information related to these objects: colour, size, position, etc.
In this step, we explore a basic drawing element: the line. The following SVG draws two blue lines, forming a cross as follows:
The following text is the SVG representation of this drawing. SVG structures data with tags delimited by < and >. It is an XML data structure. In this example, we can see an svg tag which shows the start <svg> and the end </svg> of our drawing. The two lines are specified with the tag <line>.
1
2
3
4
<svg viewBox="0 0 100 100" width="100" height="100"  xmlns="http://www.w3.org/2000/svg">
  <line x1="10" y1="10" x2="90" y2="90" stroke="blue" />
  <line x1="10" y1="90" x2="90" y2="10" stroke="blue" />
</svg>
Each tag can have properties specified in the form key=value. Thus, we can interpret that both lines are blue (colour of their stroke). The first starts in the position 10,10: 10 pixels from the canvas’ left side and 10 pixels from the canvas’ top side. It ends in 90,90, making a diagonal. The second starts in 10,90 and ends in 90,10, making the inverted diagonal.
Task 1.1 Draw a Line
We learned above how to represent a line in SVG.
Go to Replit and create a new project for this Python programming assignment.
Create a file main.py and write the function draw_line() with the following parameters.
draw_line() Docstring
1
2
3
4
5
6
7
8
"""
Format a line for SVG and return it as a string.
x -- Beginning of the line on the x-axis (pixels)
y -- Beginning of the line on the y-axis (pixels)
x2 -- End of the line on the x-axis (pixels)
y2 -- End of the line on the y-axis (pixels)
colour -- hexadecimal or colour name
"""
A single line of Python is enough for this function. We recommend using the f-string as introduced in the previous assignment.
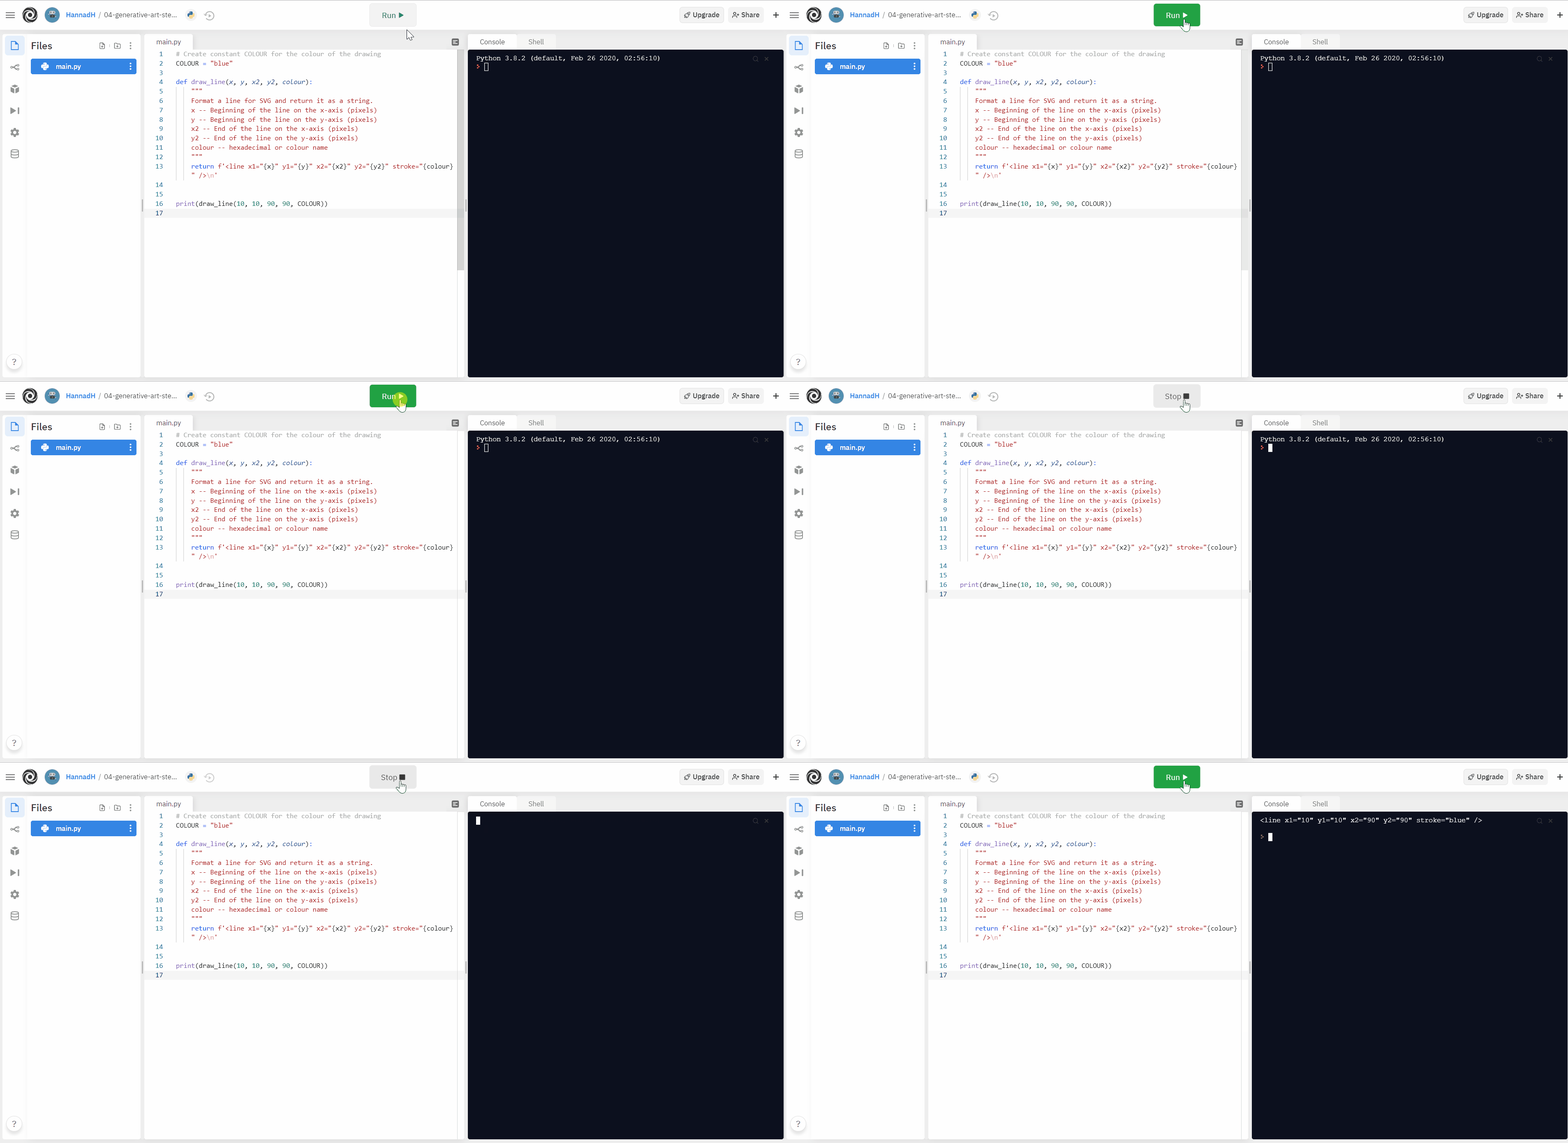
Call this function with the arguments of your choice (values for x, y, x2 and y2) and show its results to the user. Execute the code. The program should display one line of SVG describing the line.

Task 1.2 Make the Drawing of a Cross
We can now rely on the draw_line() to create more elaborated drawings such as a cross.
When we make drawings, the SVG structure needs to start with <svg> and end with </svg> as shown above in the short SVG introduction. Then, we can draw two lines diagonally opposed, which represent a cross. Finally, return the drawing.
make_drawing_cross() Docstring
1
2
3
4
"""
Make the SVG draw of a cross.
colour -- hexadecimal or colour name
"""
make_drawing_cross() Algorithm
1
2
3
4
5
Initiate the drawing of size 100x100 with the SVG tag
Draw diagonal Top-left/Bottom-right
Draw diagonal Bottom-left/top-right)
Close the drawing with the SVG tag
Return the drawing
Create the function make_drawing_cross() and call this function with the colour of your choice. We recommend creating a constant COLOUR at the top of the file to use as an argument when calling the function. Finally, Show its results to the user.
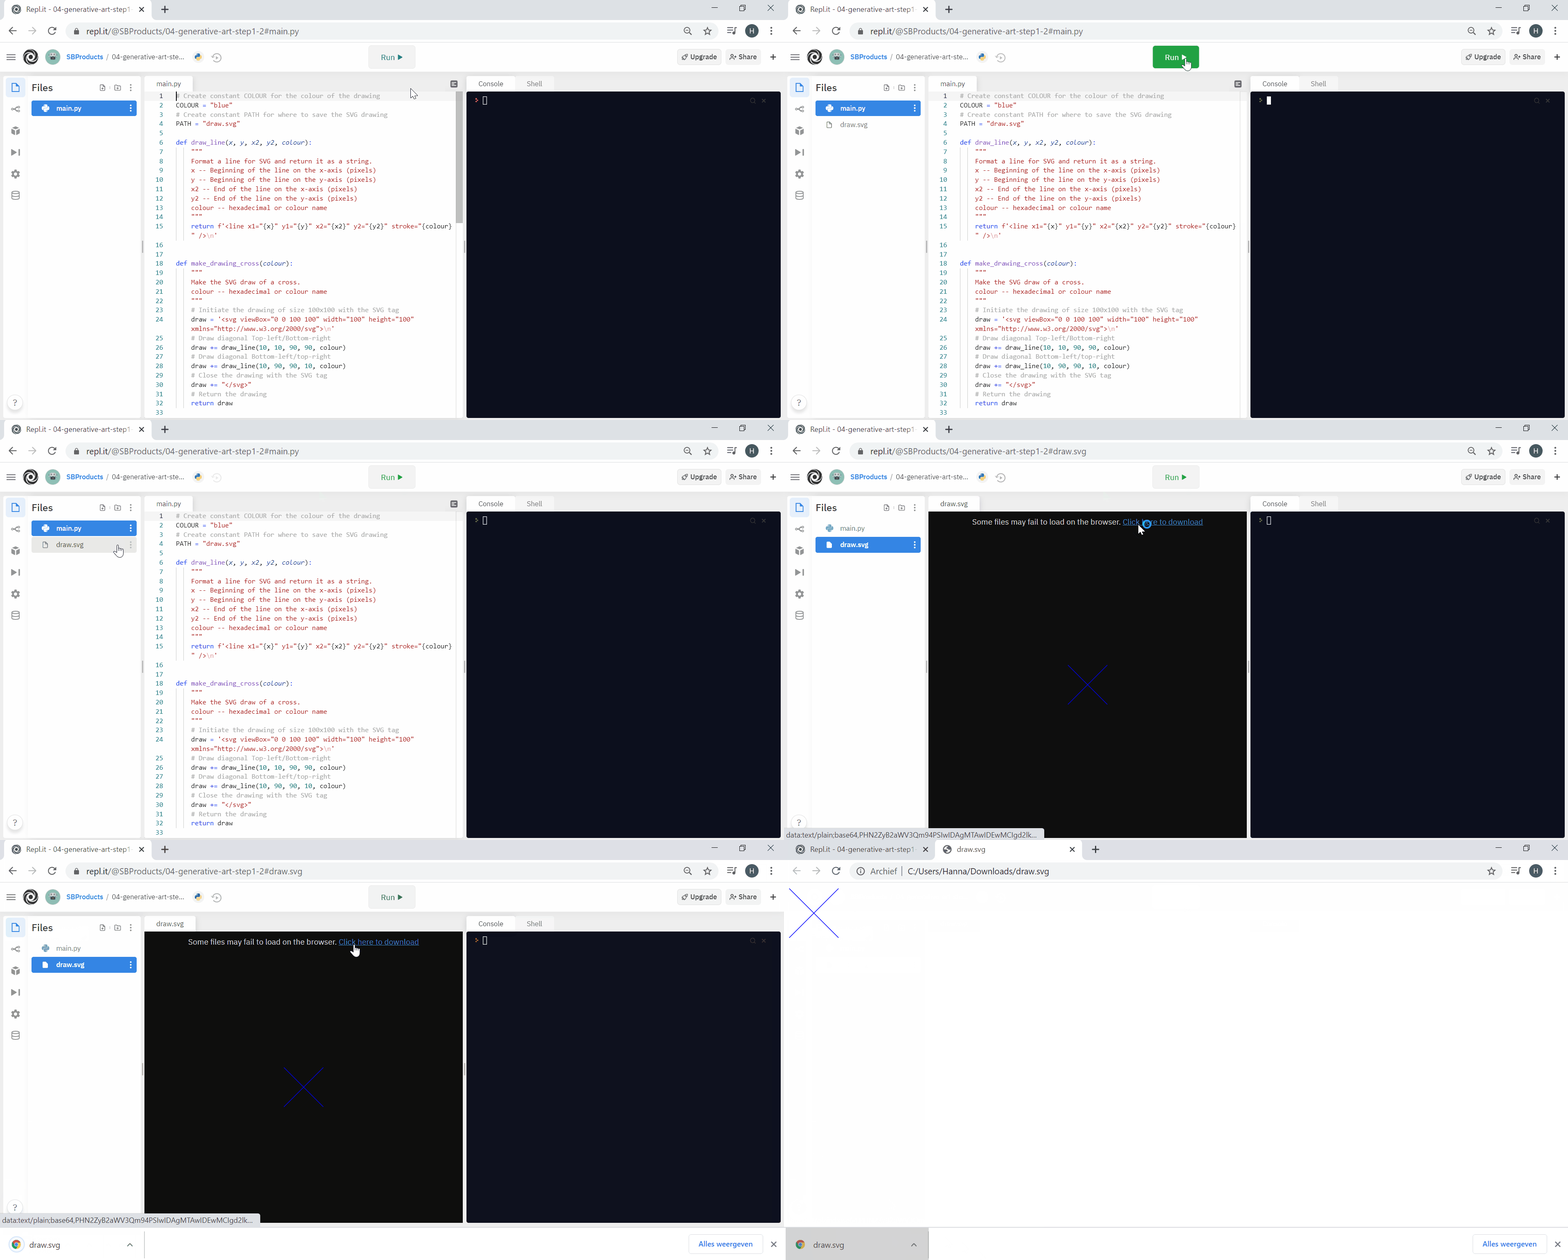
Execute the code. The program should display four lines of SVG describing the cross. However, it becomes difficult to check if the function draws the cross correctly at this stage. It would be more convenient to see a visual representation instead of the SVG data structure. Replit can visualise an SVG file. Let’s save the SVG into a file, as we wrote into files in the previous assignments.
Create a function save_in_file() to write the SVG structure into a file. It will enable us to visualise the SVG.
save_in_file() Docstring
1
2
3
4
5
"""
Save SVG drawing into a file.
path -- Where to save the file
svg_structure -- String representing the drawing
"""
We are familiar with file operation; the algorithm looks as follows:
save_in_file() Algorithm
1
2
3
Open the file path in 'write' mode and keep it in the 'file' variable
Write content in file
Close the file path
Instead of showing the result of make_drawing_cross() in the terminal, we can use its result as an argument of save_in_file(). We recommend creating a constant PATH at the top of the file, containing the path of the SVG file, such as draw.svg. Then, we can use this constant as an argument when calling the function save_in_file().
Execute the code. This time, the program should not display anything as it now writes the result into the file draw.svg. In the left panel, you should see this new file appearing. Click on it to show your drawing.

Task 1.3 Draw the Drawing of Radial Lines
How to move from a cross to radial lines like the following drawing?
We can reuse the loop construct that we learned in the previous assignment. If we start from a top-left/bottom-right diagonal, we can increase y and decrease y2 until we reach the bottom. It would draw half the lines we need.
Following the same principle, we can increase x and decrease x2 to navigate the x-axis and complete the figure.
Define a function make_drawing_radial_lines().
make_drawing_radial_lines() Docstring
1
2
3
4
"""
Make an SVG draw composed of radial lines.
colour -- hexadecimal or colour name
"""
Write the Python code of make_drawing_radial_lines() to implement the following algorithm
make_drawing_radial_lines() Algorithm
1
2
3
4
5
6
7
8
9
Initiate the drawing of size 100x100 with the SVG tag
Create variables x and y with initial value 5 (top-left)
Create variables x2 and y2 with initial value 95 (top-left)
For the height of the drawing, i with 5-pixel increments
Draw a line tilting y and y2 with +/- i
For the width of the drawing, i with 5-pixel increments
Draw a line tilting x and x2 with +/- i
Close the drawing with the SVG tag
Return the drawing
Execute the code and click on the draw.svg file to check the result.
While exploring SVG, we reviewed the critical concepts from the previous assignments: loops and functions. In the next step, we take a step back to improve the reusability of the code.