Welcome to the Machine Learning for Designers application!
Click here to go to the GitHub page where you can find all files neccesary to use the product. Click on the green “code” button and click “Download ZIP” to download all the files.
On this page, we will introduce you to the process of using machine learning (ML) in product development.
The product
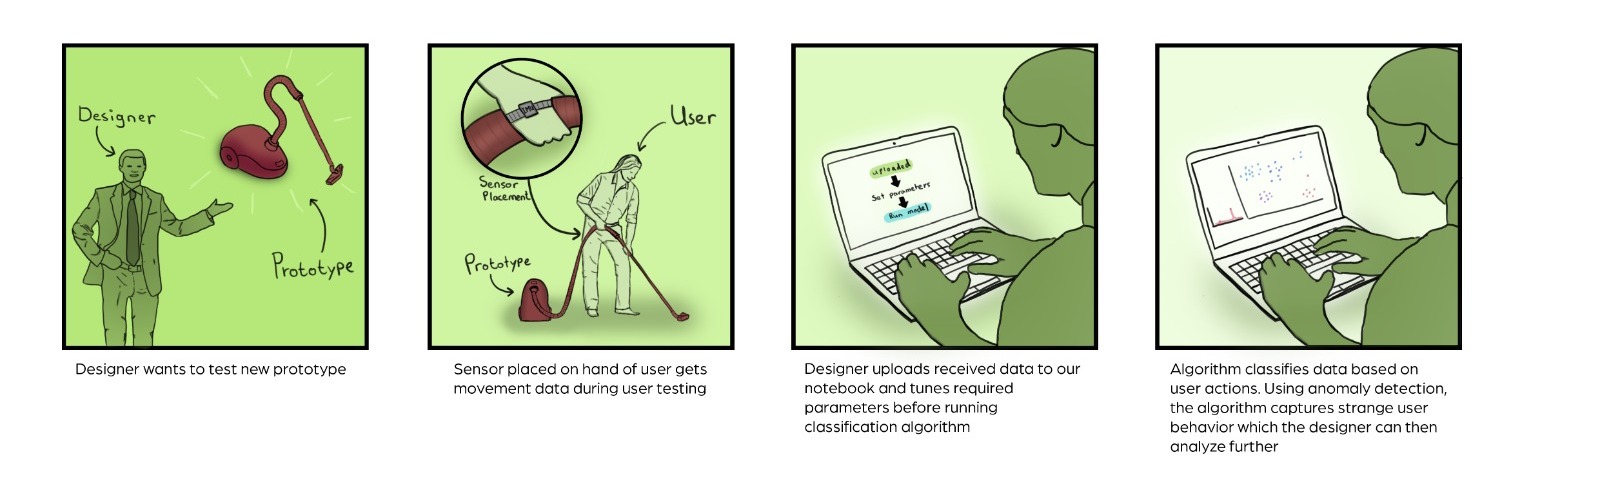
If you are a designer wanting to analyze how people will be using your product in real-time, you’ve probably had to go through the lengthy process of prototype testing. You might have even considered using sensors to make it easier to analyze larger amounts of data, but realized that it’s useless in its raw form, and you were stuck on having to investigate it manually for hours on end. We created this tool to make sense of this otherwise difficult to interpret data, and classify behavior for you to analyze efficiently. More specifically, you will be presented a chart showing the frequencies and distribution of behavior, as well as short clips showing parts of your recording where unexpected behavior occured. And the best part is, you don’t need any coding experience whatsoever to benefit from the power of machine learning.
Overview
Getting acquainted with ML
1) Read through this page
2) Open the Notebook and go through the Use Case
Preparing your data
3) Collecting your own data
4) Preprocessing
Inspecting user behavior
5) Labeling and training
6) Investigating output and results
Some additional information about the steps
Step 1: If you’ve never used Anaconda before or you’re not sure if you’ve opened the right Notebook, consult the Installation Guide. An overview of some machine learning terms you might not be familiar with can be found in our Glossary.
Step 2: If this is your first time using the product, we strongly recommend that you follow the demo. Here, you will go through the steps, but with data we collected and prepared for you. This way, you will interactively see what the data, variables and performance are supposed to look like.
Steps 3-4: To collect data, you will be using a sensor with a camera yourself. The data collection process consists of a test person using your prototype while the sensor is picking up signals. Looking at the raw sensor data will probably not make any sense, so to actually generate useful data, we will have to extract all information we need to be able to tell activities apart. This is called preprocessing.
Steps 5-6: You will notice that collecting just a few minutes of data generates thousands of data points. To make sure you will have to label as few of those as possible, you will be shown some points and be asked to label those. After that you can just sit back, let our system do its thing and evaluate the results!
If you want to find out more about what’s going on behind the scenes, consider taking a look at the Technicalities page.